


Dear Members,
Please find attached charts for your kind reference.
Happy Trading.
Posted by commoditydaily on January 31, 2011
Dear Members,
Please find attached charts for your kind reference.
Happy Trading.
Posted in Uncategorized | Leave a Comment »
Posted by commoditydaily on January 31, 2011


Dear Members,
Nifty achieved target of 5437, please find attached chart for your reference.
Happy Trading.
Best Regards,
Commodity Daily
You received this message because you are subscribed to the Google Groups “Commodity Daily” group.
To subscribe visit link http://groups.google.com/group/commoditydaily/subscribe
To unsubscribe from this group, send email to commoditydaily-unsubscribe
BLOG : http://commoditydaily.blogspot.com
Note- Members express their own view & may be or may not be having investment or speculative positions in the commodity, please do not take it as buy or sell call, pl use own judgments for buying or selling, after having discussion with your certified investment brokers or the person to whom u have good level of confidence. once sentiment is changed from good to bad no good news work but bad news do work, investors must keep this in mind.
NEW INVESTORS SHOULD BE VERY CAREFUL.
—
Posted By Commodity Daily to Commodity Daily – A World of Possibilities at 1/31/2011 02:16:00 PM
Posted in Uncategorized | Leave a Comment »
Posted by commoditydaily on January 25, 2011


Dear Members,
Gold spot breakdown of it’s triple top formation around $1380, first target achieved today @ $1337.
It is advise to keep profit stop loss as per your risk capacity as US interest rate and GDP data going to be released this week, which may potentially affect the Gold.
Happy Trading.
Posted in Uncategorized | Leave a Comment »
Posted by commoditydaily on January 17, 2011
|
GLOBAL PIVOTS – MONTHLY – JANUARY 2011.
** P M HIGH = Previous Month High, P M LOW = Previous Month Low, S = Support , R = Resistance |
|||||||||||||||
|
COMEX |
|||||||||||||||
| COMMODITY | P M HIGH | P M LOW | P M CLOSE | S4 | S3 | S2 | S1 | PIOVT | R1 | R2 | R3 | R4 | + / – | ||
| GOLD SPOT | 1431.25 | 1361.39 | 1420.78 | 1197.45 | 1267.31 | 1337.17 | 1382.81 | 1407.03 | 1452.67 | 1476.89 | 1546.75 | 1616.61 | 34.76 | ||
| SILVER SPOT | 30.94 | 27.97 | 30.92 | 21.21 | 24.18 | 27.16 | 29.33 | 30.13 | 32.30 | 33.11 | 36.08 | 39.06 | 2.84 | ||
| CRUDE JAN 11 | 92.06 | 84.20 | 91.38 | 66.21 | 74.07 | 81.93 | 87.51 | 89.79 | 95.37 | 97.65 | 105.51 | 113.37 | 6.73 | ||
|
LME |
|||||||||||||||
| ALUMINIUM 3 M | 2488.00 | 2253.00 | 2470.00 | 1716.56 | 1951.56 | 2186.56 | 2355.13 | 2421.56 | 2590.13 | 2656.56 | 2891.56 | 3126.56 | 195.00 | ||
| COPPER 3 M | 9687.00 | 8338.00 | 9600.00 | 5280.50 | 6629.50 | 7978.50 | 8968.00 | 9327.50 | 10317.00 | 10676.50 | 12025.50 | 13374.50 | 1240.00 | ||
| NICKEL 3 M | 25001.00 | 22850.00 | 24750.00 | 17909.75 | 20060.75 | 22211.75 | 23724.50 | 24362.75 | 25875.50 | 26513.75 | 28664.75 | 30815.75 | 1700.00 | ||
| TIN 3 M | 27000.00 | 24350.00 | 26900.00 | 18350.00 | 21000.00 | 23650.00 | 25600.00 | 26300.00 | 28250.00 | 28950.00 | 31600.00 | 34250.00 | 2405.00 | ||
| ZINC 3 M | 2455.00 | 2110.00 | 2454.00 | 1327.25 | 1672.25 | 2017.25 | 2269.50 | 2362.25 | 2614.50 | 2707.25 | 3052.25 | 3397.25 | 342.00 | ||
| LEAD 3 M | 2569.75 | 2231.00 | 2550.00 | 1462.69 | 1801.44 | 2140.19 | 2388.13 | 2478.94 | 2726.88 | 2817.69 | 3156.44 | 3495.19 | 320.00 | ||
|
CURRENCIES |
|||||||||||||||
| USDINR | 45.9000 | 44.6350 | 44.7050 | 41.1788 | 42.4438 | 43.7088 | 44.0475 | 44.9738 | 45.3125 | 46.2388 | 47.5038 | 48.7688 | -1.1800 | ||
| USDSGD | 1.3228 | 1.2796 | 1.2834 | 1.1631 | 1.2063 | 1.2495 | 1.2625 | 1.2927 | 1.3057 | 1.3359 | 1.3791 | 1.4223 | -0.0368 | ||
| EURUSD | 1.3499 | 1.2971 | 1.3384 | 1.1720 | 1.2248 | 1.2776 | 1.3109 | 1.3304 | 1.3637 | 1.3832 | 1.4360 | 1.4888 | 0.0401 | ||
| GBPUSD | 1.5911 | 1.5345 | 1.5612 | 1.3891 | 1.4457 | 1.5023 | 1.5268 | 1.5589 | 1.5834 | 1.6155 | 1.6721 | 1.7287 | 0.0050 | ||
| SGDINR | 34.9832 | 33.9803 | 34.8341 | 31.6415 | 32.6444 | 33.6473 | 34.3172 | 34.6502 | 35.3201 | 35.6531 | 36.6560 | 37.6589 | 0.0793 | ||
| DOLLAR INDEX | 81.3600 | 78.7750 | 79.0280 | 71.8530 | 74.4380 | 77.0230 | 77.8560 | 79.6080 | 80.4410 | 82.1930 | 84.7780 | 87.3630 | -2.1670 | ||
| USDJPY | 84.5100 | 80.9400 | 81.1200 | 71.3675 | 74.9375 | 78.5075 | 79.6450 | 82.0775 | 83.2150 | 85.6475 | 89.2175 | 92.7875 | -2.5700 | ||
|
ASIAN & AMERICAN MARKETS |
|||||||||||||||
| BSE | 20552.03 | 19074.57 | 20509.09 | 15755.89 | 17233.35 | 18710.81 | 19824.51 | 20188.27 | 21301.97 | 21665.73 | 23143.19 | 24620.65 | 987.84 | ||
| NSE | 6147.30 | 5721.15 | 6134.50 | 4765.48 | 5191.63 | 5617.78 | 5940.55 | 6043.93 | 6366.70 | 6470.08 | 6896.23 | 7322.38 | 271.80 | ||
| STRAITS TIMES | 3220.89 | 3121.07 | 3190.04 | 2895.68 | 2995.50 | 3095.32 | 3169.39 | 3195.14 | 3269.21 | 3294.96 | 3394.78 | 3494.60 | 45.34 | ||
| HANG SENG | 23612.25 | 22392.67 | 23035.45 | 19470.68 | 20690.26 | 21909.84 | 22646.59 | 23129.42 | 23866.17 | 24349.00 | 25568.58 | 26788.16 | 27.46 | ||
| DOW | 11625.00 | 11007.23 | 11577.51 | 9616.85 | 10234.62 | 10852.39 | 11315.32 | 11470.16 | 11933.09 | 12087.93 | 12705.70 | 13323.47 | 571.49 | ||
| NASDAQ | 2675.26 | 2535.19 | 2652.87 | 2220.59 | 2360.66 | 2500.73 | 2606.33 | 2640.80 | 2746.40 | 2780.87 | 2920.94 | 3061.01 | 154.64 | ||
| NIKKEI 225 | 10394.22 | 9918.55 | 10228.92 | 8796.46 | 9272.13 | 9747.80 | 10052.72 | 10223.47 | 10528.39 | 10699.14 | 11174.81 | 11650.48 | 291.88 | ||
| This research report is prepared for general information. This material is not intended as an offer or solicitation for the purchase or sale of any financial instrument. | |||||||||||||||
Posted in Uncategorized | Leave a Comment »
Posted by commoditydaily on January 17, 2011
By Rob Marstrand
01/05/11 Buenos Aires, Argentina – The supply of paper currencies is infinite; the supply of gold is finite. This striking contrast provides an excellent reason to exchange the former for the latter.
The gold supply is limited…very limited. According to one estimate, all the above-ground gold in the world totals between 120,000 and 140,000 metric tons. Let’s split the difference and call it 130,000 metric tons (about 4.2 billion troy ounces). If you brought it all together and made it into a gigantic cube, it would measure about 19 meters along each side – about three meters short of the length of a tennis court.
Furthermore, about 20% to 25% of all the gold is stored in the world’s central banks as country reserves. So the total amount of gold in private hands is enough for just 14 grams for each living person – that’s less than half the quantity of a standard one-ounce coin like a US Gold Eagle or a South African Krugerrand.
At present, only about 2.25% of the world’s total wealth – or 4.5% of world’s financial wealth – is allocated to gold, including jewelry. But resurgent inflation could raise that percentage dramatically, while raising the gold price dramatically in the process.
To gain perspective, let’s examine a brief history of the gold price relative to US inflation. The gold price peaked in January 1980 at $850/oz. But this peak was very brief. Gold jumped 29% alone in the run towards $660. Probably a better reference point for the market top is the average price during 1980 as a whole. This was $615/oz. Since then, the gold price has increased only 125%.
Over the same timespan, however, the government’s most widely quoted inflation gauge, the Consumer Price Index (CPI), has increased 185%. Therefore, if the gold price had increased as much as the CPI, it would be selling for $1,753/oz today, not $1,390/oz. But the official inflation figures might not be the real story. Using alternative inflation figures calculated by ShadowStats.com, consumer prices have soared an astounding 789% since 1980, which means that the inflation-adjusted gold price would be $5,467/oz.

Interestingly, if we look at the market bottoms for gold – 1970 and 2001 – instead of the market tops, the ShadowStats data seem to provide a much more accurate inflation gauge than the CPI. For example, in January 1970 – before gold’s 10-year bull run – the price of gold was just $35/oz. Thirty-one years later – after soaring to more than $800 an ounce in 1980 – the big bear market in gold bottomed out at $256/oz. And the average price for 2001 was $271/oz.
Therefore, during this 31-year period – through gold’s full bull and bear market cycle – the gold price advanced 674%. Over the same timeframe, the ShadowStats inflation measure advanced a nearly identical 688%. By contrast, the CPI increased only 370% during this period. In other words, the cumulative CPI readings from 1970 to 2001 failed to account for all the inflation indicated by the rising gold price. The ShadowStats figures, on the other hand, were pretty much bang on target.
I’m staying conservative, and there’s nothing to suggest that just because using the ShadowStats inflation worked for the bear market lows it will work for the bull market highs. But if the ShadowStats figures above are a guide, then maybe they point to a price north of $5,000/oz for gold – or even $7,000 for a short time.
I’ve just thrown a lot of numbers at you. But the point is this: gold looks like it has plenty of upside. But let’s be really clear about one thing. I’m not making a hard prediction or setting a price target here. These figures just provide reference points. We also need to watch out for gold “going mainstream” – when references make their way into TV programs, when taxi drivers start talking to you about gold and when your mother calls to ask how to buy an ounce of the stuff.
I can easily see gold getting into the $2,000/oz to $3,000/oz range in the next few years – maybe higher. And there’s a very real possibility that we’ll have a short-term spike – a genuine investment bubble – that takes us into the $5,000/oz to $8,000/oz.
None of this is certain. And it most likely won’t happen smoothly. There could even be big corrections along the way – like between December 1974 and August 1976 when gold fell 47% before powering ahead again. But I hope I’ve shown you that there are good reasons to think that gold still has plenty of room on the upside.
Conclusion: If you own plenty of gold already, then hang on for the ride. If not, buy more on the dips.
Read more: Why Gold Still Has a Long Way to Run http://dailyreckoning.com/why-gold-still-has-a-long-way-to-run/#ixzz1AoBrLy5X
Thanks,
Commodity Daily
You received this message because you are subscribed to the Google Groups "Commodity Daily" group.
To subscribe visit link http://groups.google.com/group/commoditydaily/subscribe
To unsubscribe from this group, send email to commoditydaily-unsubscribe
BLOG : http://commoditydaily.blogspot.com
Note- Members express their own view & may be or may not be having investment or speculative positions in the commodity, please do not take it as buy or sell call, pl use own judgments for buying or selling, after having discussion with your certified investment brokers or the person to whom u have good level of confidence. once sentiment is changed from good to bad no good news work but bad news do work, investors must keep this in mind.
NEW INVESTORS SHOULD BE VERY CAREFUL.
Posted in Uncategorized | Leave a Comment »
Posted by commoditydaily on January 3, 2011
Dian L. Chu, Economic Forecasts & Opinions | Jan. 3, 2011, 5:56 AM
Year 2010 was a good to almost all investment classes. Stocks, bonds, commodities, and dollar are all moving higher in tandem, a first of such unison since 2005. Nevertheless, commodity is the one leading the pack partly on dollar weakness, as well as propped up by world’s central banks quantitative easing. Raw materials.
Base metals, in particular, are further supported as China keeps on trucking with double-digit growth despite most of the world practically stood still during the worst global recession since World War II.
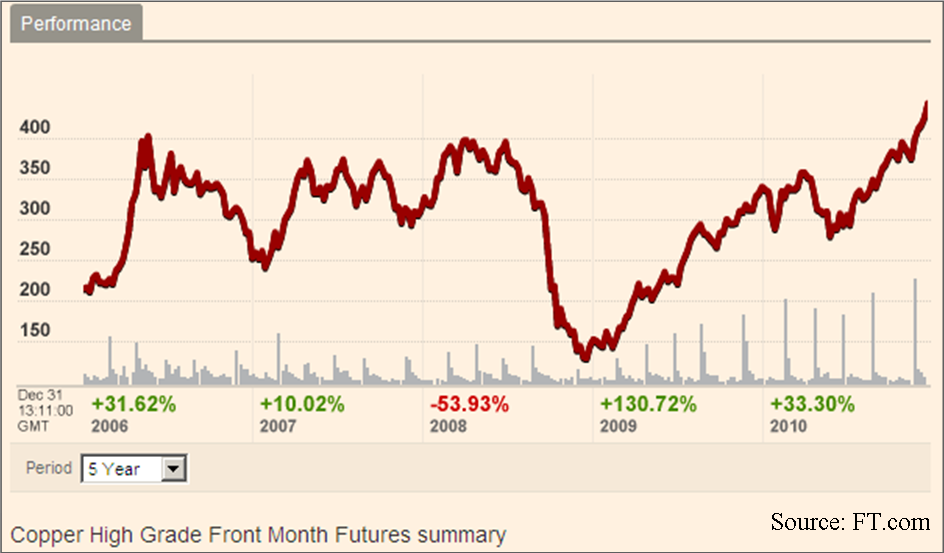
If you think Gold’s 30% gain last year is impressive, one base metal–Copper–even outshined the precious metal by rallying 33% on the year, and reached an all-time record in London, New York, and a 3-1/2 year high in Shanghai. Copper futures for March delivery on the Comex in New York stood at $4.4470 a pound at year-end, a record settlement.

Nonetheless, compared to Gold relatively steady ascend, Copper prices have been on a roller coaster ride in the past few years, dropping almost 54% in 2008 amid global financial crisis, before staging a 130% comeback in 2009, and +33% in 2010 (See Chart Above).
Santa’s Short Cover Rally
China is the world’s single largest buyer of copper. As such, copper prices typically rise and fall on any news coming out of China. However, this time around, particularly in the second half of 2010, markets did not even blink in the face of a Christmas interest rate hike and other tightening measures already implemented by China.
Before anybody declares Copper the Untouchable, I’d like to point out that the CFTC Commitment of Traders report quickly reveals that in November, commercial participants, who accounted for 54.4% of copper futures open interest, held net short positions.
This suggests some institutional players probably called the top of the market too soon, which is not that far off given the prior highs reached in pre-crisis 2008. But as I noted my analysis of gold and euro, the global excess liquidity is distorting almost all signals thus making trend analysis quite challenging. And the force majeure declared by Chile’s Collahuasi Mine around Dec. 20 only compounded the short squeeze, as Collahuasi is world’s 3rd largest copper mine accounting for about 3% of annual world supply.
So, that means the 14% jump in December month was largely a short covering rally. Now, looking ahead into 2011, the price direction of copper will likely still hinge on supply, and mostly China demand, but it also depends on a couple of new market factors emerged just within the last year or so.
A More diversified Supply Base
On the fundamental side, the red base metal is seen as an economic barometer since it is mainly used in building construction and electronics accounting for about 50% and 21% of the copper usage respectively in the United States. Transportation equipment (11%), consumer and general products (10%), and industrial machinery and equipment (8%) are the other major industrial usage sectors, according to USGS.
Fortunately, unlike rare earth metals, whose supply is single-sourced to China, Copper has a more diversified supply base. Chile, Peru and the U.S. account for around 50% of world’s copper production with Chile supplying over one third of world’s copper demand (See Chart).

A Looming Supply Shortage
The bad news is that similar to crude oil and many other natural resources, existing copper deposits are getting exhausted, ore grades are declining, and new finds are far and few in between to make up for the depletion (See Chart Below).

Many analysts are forecasting a supply shortage in 2011 as the global economic recovery ramps up. Although estimates vary, the expected supply shortfall in 2011 ranges from 380,000 metric tons by BMO to Barclay’s 825,000 metric ton.
China Demand Could Decrease on Further Tightening
Even though global economy has improved significantly since financial crisis, producers have admitted that demand is still not quite back to pre-crisis 2008 levels. So, many of these forecasts are largely based on the expectation that China demand growth will remain healthy.
While most copper bulls are pointing to China’s refined copper imports was up 37% month over month in Nov, which was the first in three months, according to Reuters, the year to date figure was a fairly modest 5% year-over-year growth, a far cry from the 25% growth in 2009. Even producer BHP Billiton expected a decline in Chinese demand in 2010 (See Chart Below).

Moreover, as Beijing is gearing up for more tightening and restrictions, particularly on the real estate and auto sectors, to fight off inflation, asset bubbles and traffic congestion, I expect Chinese copper consumption may actually decrease by 8% to 10% in next year or two.
China’s "Unreported" Inventories
Some analysts cited declining stocks level as another bullish indication. But recent data show LME copper inventories rose to a 3-month high (See Inventory Chart), and bear in mind that China is widely believed to have huge stock piles of unreported government and industry inventories.

Furthermore, I think most people may have underestimated the possibility that China would use its purchasing power and stock piles to "level the copper playing field", so to speak, as China typically does not like to come in at the near top of the market.
Little Ado About Yuan
Another often cited bullish factor for copper is that a strengthening Chinese Yuan will spur more imports by the world’s largest consumer. Currency valuation, although is one factor likely to affect buying behavior, it is unlikely to outweigh the other more powerful drivers such as real demand, and arbitrage opportunities. And if anything, copper, like most commodities priced in dollar, is most sensitive to the dollar movement instead of Yuan.
Everybody Loves Copper
With most of the shorts blown out by the Collahuasi Mine’s force majeure, copper markets are now predominately long. In addition to the entire country of China being long Copper probably for the next decade or more, prices are expected to receive further support from the new exchange-traded funds (ETF) backed by physical copper. ETF Securities launched an ETF on Dec. 10, and J.P. Morgan Chase & Co. and BlackRock are also looking to launch copper ETFs.
Meanwhile, media reports citing data from London Metal Exchange (LME) said one trader (rumored to be JPMorgan Chase & Co.) currently holds 80-90% of the 377,550 metric tons of copper stored in LME approved warehouses, valued at around $3.5 billion. I would not be surprised if this one trader is acting on behalf of an ETF or investment bank.
Bigger Crash, But High Floor
When the majority of the market is long, it also means whenever there’s something bad happening, (e.g. China hard landing, European debt contagion, just name your crisis) the selloff will tend to be swift and en masse. (Just imagine that single trader holding 80-90% of LME Copper inventory suddenly needs to liquidate the position for whatever reason.)
But on the flip side, this also means ETFs could do to Copper as SPDR Gold Trust (GLD) has done for the Gold market—increase investments and fund inflows. This, coupled with increasing investors demand as a hedge against currency and inflation, will likely put in a new and higher floor for copper, probably in the $3 a pound range, give or take 20 cents.
Market Ahead of Itself
As deficient as China’s transportation system is, it also says a lot about the long-term consumption growth prospect of copper on a per capita basis (see Chart Below). Goldman Sachs, for example, is projecting copper at $11,000/mt (14% increase from the record high of $9,660 reached on LME), and "believes that prices could spike substantially above these levels, most likely in late 2011."

However, I think Copper’s 55% price jump since July is a clear indication that a robust demand trend (from China or elsewhere) is already priced in…and then some. So, it looks like the copper market is getting ahead of itself, which indicates limited upside and more downside risks in the New Year.
The Third Reserve Currency
Just like $100 a barrel is a psychological barrier for crude oil that would drive changes in demand pattern, $5.00 a pound would be that same barrier for Copper. On that note and in combination of what we’ve discussed so far, Copper would be hard-pressed to top $5.00 / lb in 2011. However, I must say there’s is a possibility that cooper could go to $5.50 as investors consider copper as the third reserve currency behind dollar and gold, since silver is much more volatitle.
I think copper should be a correction in the first quarter with some profit taking after the New Year, followed by some buying on the dip. Then there would be a pullback in summer followed by a runup towards the end of 2011.
Stairs Up, Freight Elevator Down
If crude is to take escalator up, but elevator down, expect copper to take the stairs up, and freight elevator down if anythings goes wrong in China. Overall, Copper should see major support at $3.80, $3.50, and $3.20. A break below $3.20 would be an extremely bearish indicator. On the upside, $4.75 and $5.00 should be the next two resistance levels.
Posted in Uncategorized | Leave a Comment »
