| Gold Pivot Points Weekly – 15th Feb to 19th Feb 2010 | ||||||||
| 2/17/10 6:09 PM | ||||||||
| W High | W Low | W Close | W Open | |||||
| 1098.40 | 1061.80 | 1090.00 | 1093.70 | |||||
| Formula #1: PWH + L + C | ||||||||
| S4 | S3 | S2 | S1 | Pivot | R1 | R2 | R3 | R4 |
| 973.60 | 1010.20 | 1046.80 | 1068.40 | 1083.40 | 1105.00 | 1120.00 | 1156.60 | 1193.20 |
| Formula #2: PWH + L + T O | ||||||||
| S4 | S3 | S2 | S1 | Pivot | R1 | R2 | R3 | R4 |
| 974.83 | 1011.43 | 1048.03 | 1070.87 | 1084.63 | 1107.47 | 1121.23 | 1157.83 | 1194.43 |
| Formula #3: PWH + L + C + T O | ||||||||
| S4 | S3 | S2 | S1 | Pivot | R1 | R2 | R3 | R4 |
| 976.17 | 1012.78 | 1049.38 | 1073.55 | 1085.98 | 1110.15 | 1122.58 | 1159.18 | 1195.775 |
Archive for February, 2010
Gold Pivot Points Weekly – 15th Feb to 19th Feb 2010
Posted by commoditydaily on February 17, 2010
Posted in Uncategorized | Leave a Comment »
Gold Pivot Points Fortnight – 15th Feb 10 to 26th Feb 10
Posted by commoditydaily on February 17, 2010
| Gold Pivot Points Fortnight – 15th Feb 10 to 26th Feb 10 | ||||||||
| 2/17/10 6:06 PM | ||||||||
| F High | F Low | F Close | F Open | |||||
| 1126.40 | 1044.50 | 1090.00 | 1093.70 | |||||
| Formula #1: PWH + L + C | ||||||||
| S4 | S3 | S2 | S1 | Pivot | R1 | R2 | R3 | R4 |
| 841.27 | 923.17 | 1005.07 | 1047.53 | 1086.97 | 1129.43 | 1168.87 | 1250.77 | 1332.67 |
| Formula #2: PWH + L + T O | ||||||||
| S4 | S3 | S2 | S1 | Pivot | R1 | R2 | R3 | R4 |
| 842.50 | 924.40 | 1006.30 | 1050.00 | 1088.20 | 1131.90 | 1170.10 | 1252.00 | 1333.90 |
| Formula #3: PWH + L + C + T O | ||||||||
| S4 | S3 | S2 | S1 | Pivot | R1 | R2 | R3 | R4 |
| 842.95 | 924.85 | 1006.75 | 1050.90 | 1088.65 | 1132.80 | 1170.55 | 1252.45 | 1334.35 |
Posted in Uncategorized | Leave a Comment »
Commodity Daily – A World of Possibilities Gold / Crude / Euro – Correlation update 12 feb 10…
Posted by commoditydaily on February 12, 2010


Euro no more correlated to Gold since yesterday …..Will Gold correct to $980 ?? or Euro will rise again to 1.3900 🙂
—
Thanks,
Commodity Daily
You received this message because you are subscribed to the Google Groups "Commodity Daily" group.
To subscribe visit link http://groups.google.com/group/commoditydaily/subscribe
To unsubscribe from this group, send email to commoditydaily-unsubscribe
BLOG : http://commoditydaily.blogspot.com
Note- Members express their own view & may be or may not be having investment or speculative positions in the commodity, please do not take it as buy or sell call, pl use own judgments for buying or selling, after having discussion with your certified investment brokers or the person to whom u have good level of confidence. once sentiment is changed from good to bad no good news work but bad news do work, investors must keep this in mind.
NEW INVESTORS SHOULD BE VERY CAREFUL.
Posted in Uncategorized | Leave a Comment »
Commodity Daily – A World of Possibilities GOLD Pivot Points Weekly – 8th t…
Posted by commoditydaily on February 9, 2010
| GOLD Pivot Points Weekly – 8th to 12th Feb 2010 | ||||||||
| 2/8/10 1:42 PM | ||||||||
| W High | W Low | W Close | W Open | |||||
| 1126.40 | 1044.50 | 1052.80 | 1068.30 | |||||
| Formula #1: PWH + L + C | ||||||||
| S4 | S3 | S2 | S1 | Pivot | R1 | R2 | R3 | R4 |
| 828.87 | 910.77 | 992.67 | 1022.73 | 1074.57 | 1104.63 | 1156.47 | 1238.37 | 1320.27 |
| Formula #2: PWH + L + T O | ||||||||
| S4 | S3 | S2 | S1 | Pivot | R1 | R2 | R3 | R4 |
| 834.03 | 915.93 | 997.83 | 1033.07 | 1079.73 | 1114.97 | 1161.63 | 1243.53 | 1325.43 |
| Formula #3: PWH + L + C + T O | ||||||||
| S4 | S3 | S2 | S1 | Pivot | R1 | R2 | R3 | R4 |
| 827.30 | 909.20 | 991.10 | 1019.60 | 1073.00 | 1101.50 | 1154.90 | 1236.80 | 1318.7 |
Posted in Uncategorized | Leave a Comment »
Commodity Daily – A World of Possibilities Market Update – 9 Feb 2010
Posted by commoditydaily on February 9, 2010
| 09/02/2010 17:39 | |||||||||||||
| ** P D HIGH = Previous Day High, P D LOW = Previous Day Low, P CLOSE = Previous Day Close | |||||||||||||
| IF "COMMODITY" & "+ / -" BOTH COLOMN ARE IN "RED" = BEARISH & IF "GREEN" = BULLISH | |||||||||||||
| ** SELL Signal = If price close below PIVOT POINT or Previous Day Low ** BUY Signal = If price close above PIVOT POINT or Previous Day High | |||||||||||||
| S = Support , R = Resistance | |||||||||||||
| COMEX | |||||||||||||
| COMMODITY | P D HIGH | P D LOW | CURRENT | S4 | S3 | S2 | S1 | PIOVT | R1 | R2 | R3 | R4 | + / – |
| GOLD APR 10 | 1074.30 | 1061.80 | 1069.70 | 1028.68 | 1041.18 | 1053.68 | 1058.05 | 1066.18 | 1070.55 | 1078.68 | 1091.18 | 1103.68 | 13.40 |
| SILVER MAR 10 | 15.32 | 14.95 | 15.21 | 13.99 | 14.36 | 14.73 | 14.87 | 15.10 | 15.24 | 15.47 | 15.84 | 16.21 | 0.26 |
| CRUDE MAR 09 | 72.39 | 70.77 | 72.34 | 66.83 | 68.45 | 70.07 | 70.99 | 71.69 | 72.61 | 73.31 | 74.93 | 76.55 | 0.70 |
| LME | |||||||||||||
| COPPER 3 M | 6475.00 | 6340.00 | 6450.00 | 6008.75 | 6143.75 | 6278.75 | 6352.50 | 6413.75 | 6487.50 | 6548.75 | 6683.75 | 6818.75 | 170.00 |
| NICKEL 3 M | 17398.00 | 16975.00 | 17275.00 | 15919.25 | 16342.25 | 16765.25 | 16978.50 | 17188.25 | 17401.50 | 17611.25 | 18034.25 | 18457.25 | 225.00 |
| TIN 3 M | 15400.00 | 14850.00 | 15200.00 | 13512.50 | 14062.50 | 14612.50 | 14925.00 | 15162.50 | 15475.00 | 15712.50 | 16262.50 | 16812.50 | -250.00 |
| CURRENCIES | |||||||||||||
| USDINR | 46.9000 | 46.6550 | 46.6488 | 46.0475 | 46.2925 | 46.5375 | 46.6650 | 46.7825 | 46.9100 | 47.0275 | 47.2725 | 47.5175 | 0.0800 |
| USDSGD | 1.4245 | 1.4185 | 1.4190 | 1.4035 | 1.4095 | 1.4155 | 1.4185 | 1.4215 | 1.4245 | 1.4275 | 1.4335 | 1.4395 | -0.0005 |
| EURUSD | 1.3718 | 1.3622 | 1.3737 | 1.3395 | 1.3491 | 1.3587 | 1.3647 | 1.3683 | 1.3743 | 1.3779 | 1.3875 | 1.3971 | 0.0065 |
| GBPUSD | 1.5660 | 1.5535 | 1.5606 | 1.5247 | 1.5372 | 1.5497 | 1.5585 | 1.5622 | 1.5710 | 1.5747 | 1.5872 | 1.5997 | 0.0021 |
| SGDINR | 32.9620 | 32.1815 | 32.8741 | 30.4080 | 31.1885 | 31.9690 | 32.5370 | 32.7495 | 33.3175 | 33.5300 | 34.3105 | 35.0910 | 0.0598 |
| ASIAN & AMERICAN MARKETS | |||||||||||||
| BSE | 16061.41 | 15651.99 | 16059.01 | 14655.04 | 15064.46 | 15473.88 | 15705.19 | 15883.30 | 16114.61 | 16292.72 | 16702.14 | 17111.56 | 144.68 |
| NSE | 4799.05 | 4675.40 | 4797.40 | 4377.90 | 4501.55 | 4625.20 | 4698.65 | 4748.85 | 4822.30 | 4872.50 | 4996.15 | 5119.80 | 41.75 |
| STRAITS TIMES | 2700.85 | 2665.97 | 2745.02 | 2580.44 | 2615.32 | 2650.20 | 2669.31 | 2685.08 | 2704.19 | 2719.96 | 2754.84 | 2789.72 | 10.06 |
| HANG SENG | 19673.11 | 19423.05 | 19790.28 | 18784.96 | 19035.02 | 19285.08 | 19397.17 | 19535.14 | 19647.23 | 19785.20 | 20035.26 | 20285.32 | -114.19 |
| DOW | 10028.56 | 9904.09 | 9908.39 | 9588.21 | 9712.68 | 9837.15 | 9894.68 | 9961.62 | 10019.15 | 10086.09 | 10210.56 | 10335.03 | -103.84 |
| NASDAQ | 2152.64 | 2125.11 | 2126.05 | 2053.39 | 2080.92 | 2108.45 | 2119.31 | 2135.98 | 2146.84 | 2163.51 | 2191.04 | 2218.57 | -15.07 |
Posted in Uncategorized | Leave a Comment »
GOLD HDWM Update 05 Feb 2010 – Must Read – Why GOLD Falling :)
Posted by commoditydaily on February 5, 2010
Dear Members,
Please find attached PDF and GIF files for your reference.


—
Thanks,
Commodity Daily
You received this message because you are subscribed to the Google Groups "Commodity Daily" group.
To subscribe visit link http://groups.google.com/group/commoditydaily/subscribe
To unsubscribe from this group, send email to commoditydaily-unsubscribe
BLOG : http://commoditydaily.blogspot.com
Note- Members express their own view & may be or may not be having investment or speculative positions in the commodity, please do not take it as buy or sell call, pl use own judgments for buying or selling, after having discussion with your certified investment brokers or the person to whom u have good level of confidence. once sentiment is changed from good to bad no good news work but bad news do work, investors must keep this in mind.
NEW INVESTORS SHOULD BE VERY CAREFUL.
—
Posted By Commodity Daily to Commodity Daily – A World of Possibilities at 2/05/2010 08:42:00 PM
Posted in Uncategorized | Leave a Comment »
Gold Price Holds Up for Non-U.S. Investors
Posted by commoditydaily on February 1, 2010
Dear Members,
Gold looks technically bearish when looking on the US Dollar and Yen price per ounce but appears to bottom out in most other major currencies.
The Euro’s strong decline to a 6-month low below $1.39 in the wake of continuing woes about Greece’s precarious position, probably only a precursor to more deficit disasters in the Eurozone, has cushioned gold’s correction from the all time high for Euro investors. Swiss and British savers see a similarly pronounced effect.
Gold has also built what could be a bottom in Australian and Canadian dollars.
I am always puzzled to see that gold prices are still exclusively expressed in Federal Reserve Notes in media worldwide as this masks the real change for local investors.
The charts below again confirm my thoughts about fundamental flaws in technical forecasting, like simply which chart to take in the first place. Most investment advisors outside the US (and Japan) should actually ring the buy bell based on stabilizing domestic gold prices.
Gold in FRN/Dollars
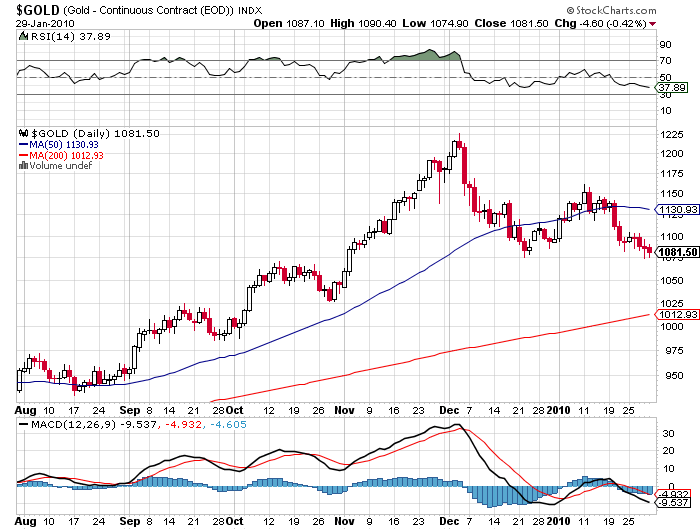
CHART: Gold priced in Federal Reserve Notes [FRN] looks certainly bearish.
Gold in Euros
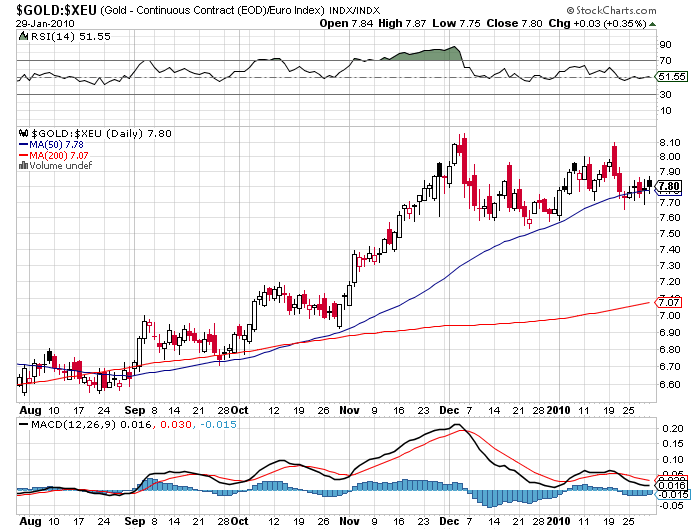
CHART: Gold priced in Euros held up fairly well thanks to stronger FRN and erased half of the losses since the top by now. This is an entirely different picture compared to FRN.
Gold/DXY
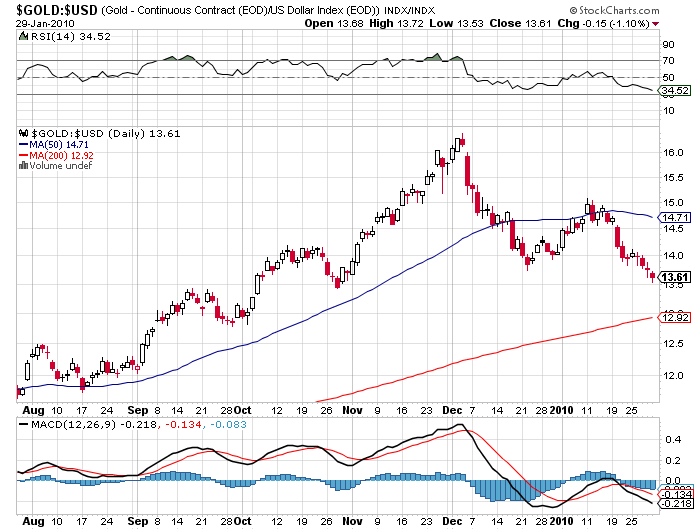
CHART: Gold price expressed in USD Index units. The downtrend is due to the heavy weighting of Yen in the index.
Gold in Sterling
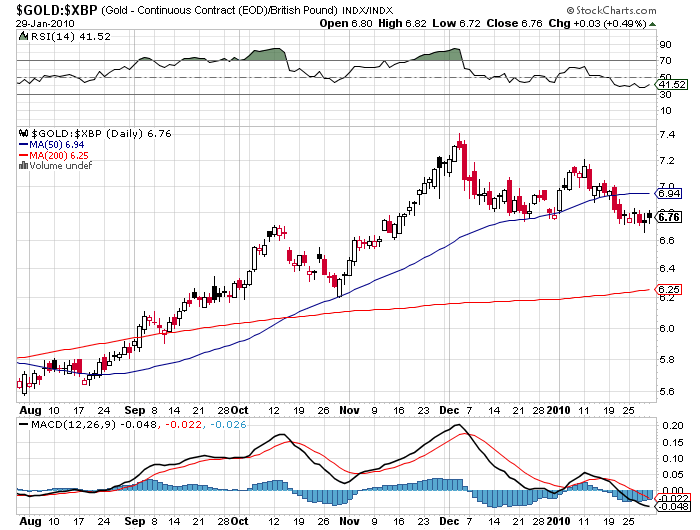
CHART: Gold priced in British Pounds. Brits, caught in the deepest recession, do well with gold.
Gold in Swiss Francs
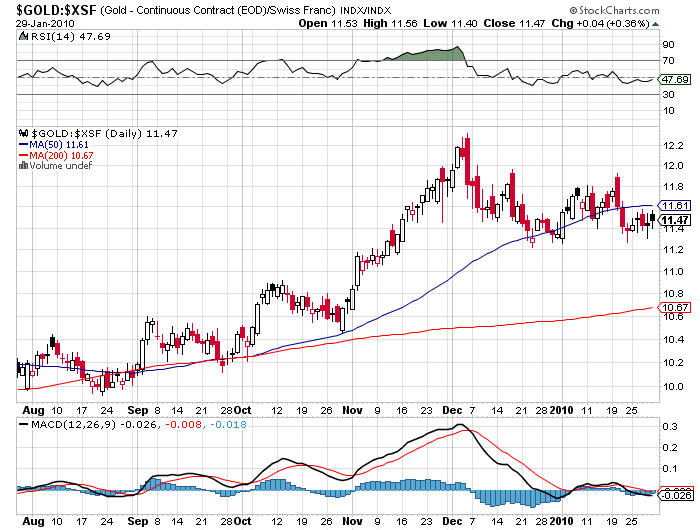
CHART: Gold priced in Swiss Francs. The Swiss may fare well with gold if the banking world amidst the Alps caves in.
Gold in Yen
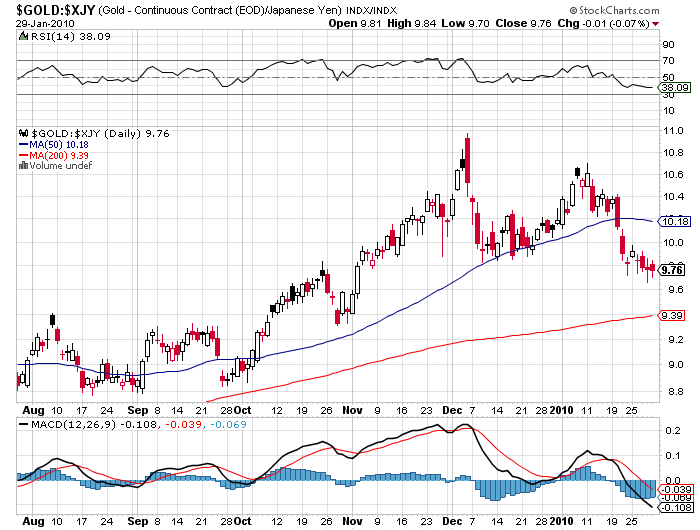
CHART: Gold priced in Yen. I expect this chart to turn bullish as Japan’s net debt-to-GDP ratio exceeds 115%, the highest in the developed world, while demographics will impede any structural growth chances.
Gold in Australian Dollars
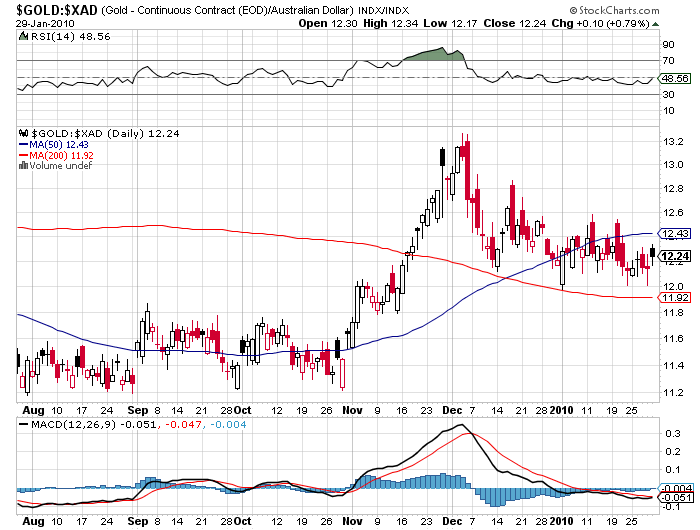
CHART: Gold priced in Australian Dollars has bottomed out, it appears.
Gold in Canadian Dollars
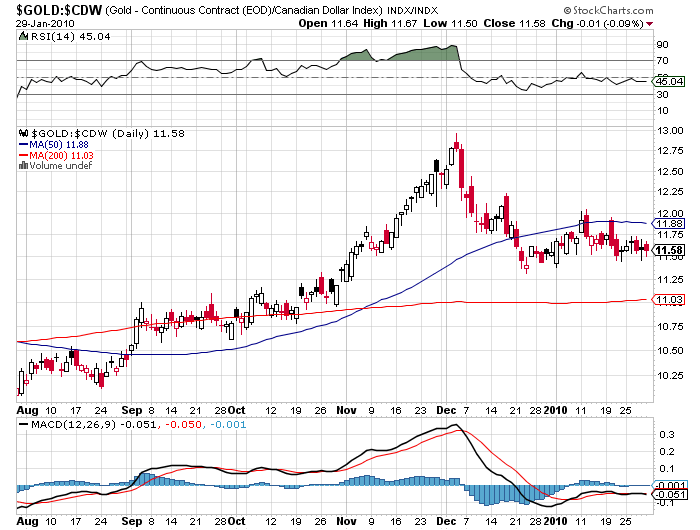
CHART: Gold priced in Canadian Dollars. A commodity currency like the Aussie dollar, the Loonie manages to avoid further appreciation against FRN.
Gold in Indian Rupees
CHART: Gold priced in Indian Rupees. With not much recovery news coming out of India the Indian Rupee has stabilized against the US currency, hitting Indian gold holders twice.
Deficit Madness Fundamentally Supports Gold
Speculations that US President Barack Obama will most likely present a US budget that will see the deficit explode to $1.556 Trillion, after an earlier, more conservative estimate of $1.35 Trillion by the Congressional Budget Office, were fueled by a Reuters report:
A congressional source told Reuters that the White House would project a record $1.6 trillion deficit for the United States in the current 2010 fiscal year that ends Sept. 30. That is an increase from the $1.4 trillion gap in 2009.
The budget is due out at 10 a.m. EST/1500 GMT
Posted in Uncategorized | Leave a Comment »
GOLD Weekly Pivots – 1st Feb to 5th Feb 2010
Posted by commoditydaily on February 1, 2010
Dear Members,
| Gold Pivot Points Weekly – 1st Feb 10 to 5th Feb 10 | ||||||||
| 2/1/10 3:08 PM | ||||||||
| W High | W Low | W Close | W Open | |||||
| 1096.30 | 1074.40 | 1083.80 | 1081.90 | |||||
| Formula #1: PWH + L + C | ||||||||
| S4 | S3 | S2 | S1 | Pivot | R1 | R2 | R3 | R4 |
| 1019.13 | 1041.03 | 1062.93 | 1073.37 | 1084.83 | 1095.27 | 1106.73 | 1128.63 | 1150.53 |
| Formula #2: PWH + L + T O | ||||||||
| S4 | S3 | S2 | S1 | Pivot | R1 | R2 | R3 | R4 |
| 1018.50 | 1040.40 | 1062.30 | 1072.10 | 1084.20 | 1094.00 | 1106.10 | 1128.00 | 1149.90 |
| Formula #3: PWH + L + C + T O | ||||||||
| S4 | S3 | S2 | S1 | Pivot | R1 | R2 | R3 | R4 |
| 1018.40 | 1040.30 | 1062.20 | 1071.90 | 1084.10 | 1093.80 | 1106.00 | 1127.90 | 1149.8 |
Posted in Uncategorized | Leave a Comment »
GOLD Fortnight Pivots – 1st Feb to 12 Feb 2010
Posted by commoditydaily on February 1, 2010
Dear Members,
| Quick Pivot Points Fortnight – 1st Feb 10 to 12th Feb 10 | ||||||||
| 2/1/10 3:34 PM | ||||||||
| F High | F Low | F Close | F Open | |||||
| 1142.90 | 1074.40 | 1083.80 | 1081.90 | |||||
| Formula #1: PWH + L + C | ||||||||
| S4 | S3 | S2 | S1 | Pivot | R1 | R2 | R3 | R4 |
| 894.87 | 963.37 | 1031.87 | 1057.83 | 1100.37 | 1126.33 | 1168.87 | 1237.37 | 1305.87 |
| Formula #2: PWH + L + T O | ||||||||
| S4 | S3 | S2 | S1 | Pivot | R1 | R2 | R3 | R4 |
| 894.23 | 962.73 | 1031.23 | 1056.57 | 1099.73 | 1125.07 | 1168.23 | 1236.73 | 1305.23 |
| Formula #3: PWH + L + C + T O | ||||||||
| S4 | S3 | S2 | S1 | Pivot | R1 | R2 | R3 | R4 |
| 890.25 | 958.75 | 1027.25 | 1048.60 | 1095.75 | 1117.10 | 1164.25 | 1232.75 | 1301.25 |
Posted in Uncategorized | Leave a Comment »
Gold Monthly Pivots – Feb 2010
Posted by commoditydaily on February 1, 2010
Dear Members,
| GOLD Pivot Points Monthly – FEB 2010 | ||||||||
| 2/1/10 3:28 PM | ||||||||
| M High | M Low | M Close | M Open | |||||
| 1166.70 | 1074.40 | 1083.80 | 1081.90 | |||||
| Formula #1: PMH + L + C | ||||||||
| S4 | S3 | S2 | S1 | Pivot | R1 | R2 | R3 | R4 |
| 831.40 | 923.70 | 1016.00 | 1049.90 | 1108.30 | 1142.20 | 1200.60 | 1292.90 | 1385.20 |
| Formula #2: PMH + L + T O | ||||||||
| S4 | S3 | S2 | S1 | Pivot | R1 | R2 | R3 | R4 |
| 830.77 | 923.07 | 1015.37 | 1048.63 | 1107.67 | 1140.93 | 1199.97 | 1292.27 | 1384.57 |
| Formula #3: PMH + L + C + T O | ||||||||
| S4 | S3 | S2 | S1 | Pivot | R1 | R2 | R3 | R4 |
| 824.80 | 917.10 | 1009.40 | 1036.70 | 1101.70 | 1129.00 | 1194.00 | 1286.30 | 1378.6 |
Posted in Uncategorized | Leave a Comment »
