Archive for June, 2010
$ COMMODITY DAILY – GRB $ Global Pivots – Weekly – 28th June 2010 to 2nd July 2010
Posted by commoditydaily on June 28, 2010
Posted in Uncategorized | Leave a Comment »
Gold Hourly Bear Flag 23 June 2010
Posted by commoditydaily on June 23, 2010
Find attached analysis for your reference.

Posted in Uncategorized | Leave a Comment »
Global Market Pivots – Weekly – 21st June 10 to 25th June 2010
Posted by commoditydaily on June 21, 2010
Posted in Uncategorized | Leave a Comment »
It’s changed Finally – Gold & Dollar inversely correlated now….
Posted by commoditydaily on June 18, 2010
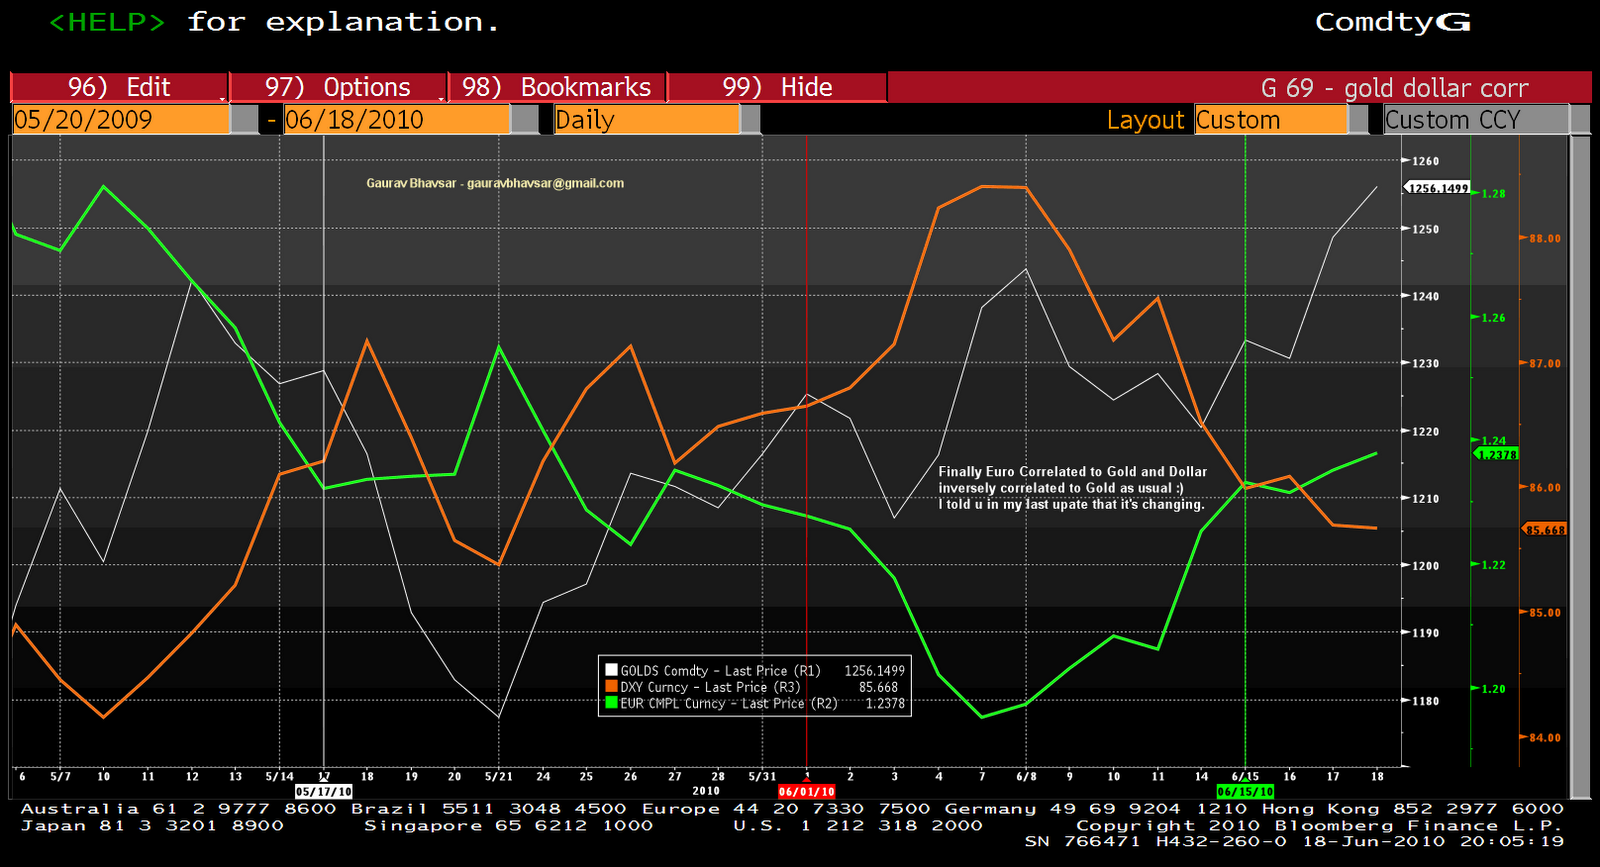
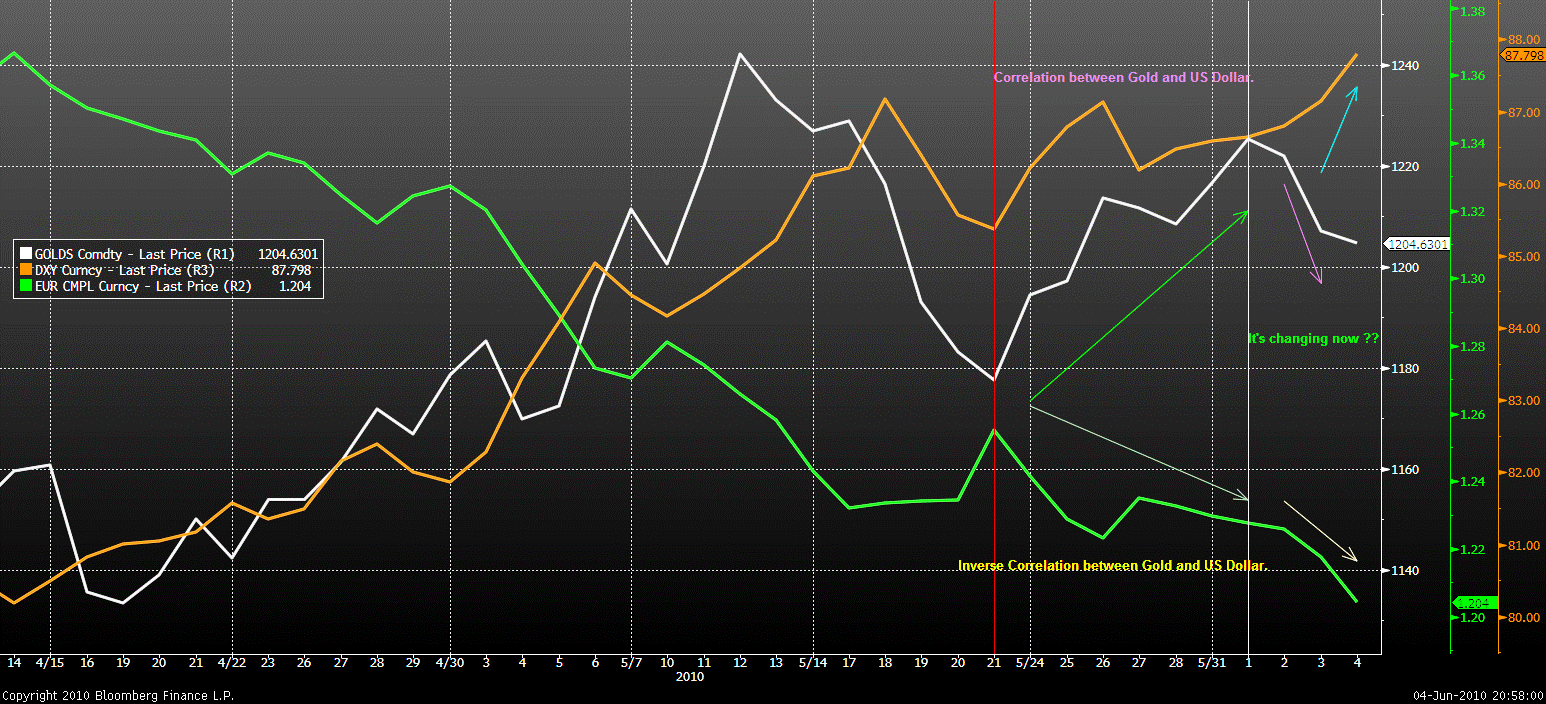
I intimated the expected correlation change between Euro, Gold and Dollar in my last update on 4th June 2010, Now check the result 🙂
Thanks,
Commodity Daily
You received this message because you are subscribed to the Google Groups "Commodity Daily" group.
To subscribe visit link http://groups.google.com/group/commoditydaily/subscribe
To unsubscribe from this group, send email to commoditydaily-unsubscribe
BLOG : http://commoditydaily.blogspot.com
Note- Members express their own view & may be or may not be having investment or speculative positions in the commodity, please do not take it as buy or sell call, pl use own judgments for buying or selling, after having discussion with your certified investment brokers or the person to whom u have good level of confidence. once sentiment is changed from good to bad no good news work but bad news do work, investors must keep this in mind.
NEW INVESTORS SHOULD BE VERY CAREFUL.
—
Posted By Commodity Daily to Commodity Daily – A World of Possibilities at 6/18/2010 08:18:00 PM
Posted in Uncategorized | Leave a Comment »
Triveni Engineering Wedge (Bullish) formation – 15 June 2010
Posted by commoditydaily on June 15, 2010
+formation+-+15+June+2010-781554.gif)
Find attached analysis for your reference.
Posted in Uncategorized | Leave a Comment »
MCX Pivot Points – Daily – 15 June 2010
Posted by commoditydaily on June 15, 2010
Posted in Uncategorized | Leave a Comment »
Gold Spot Hourly – Target met for HNS formation of 9 Jun 2010 – update 11 Jun 2010
Posted by commoditydaily on June 11, 2010


Gold spot target has been met yesterday indicated on 9th June 2010, check the charts for the fact.
Posted in Uncategorized | Leave a Comment »
Gold Hourly – Possible HNS formation – 9 June 2010
Posted by commoditydaily on June 9, 2010
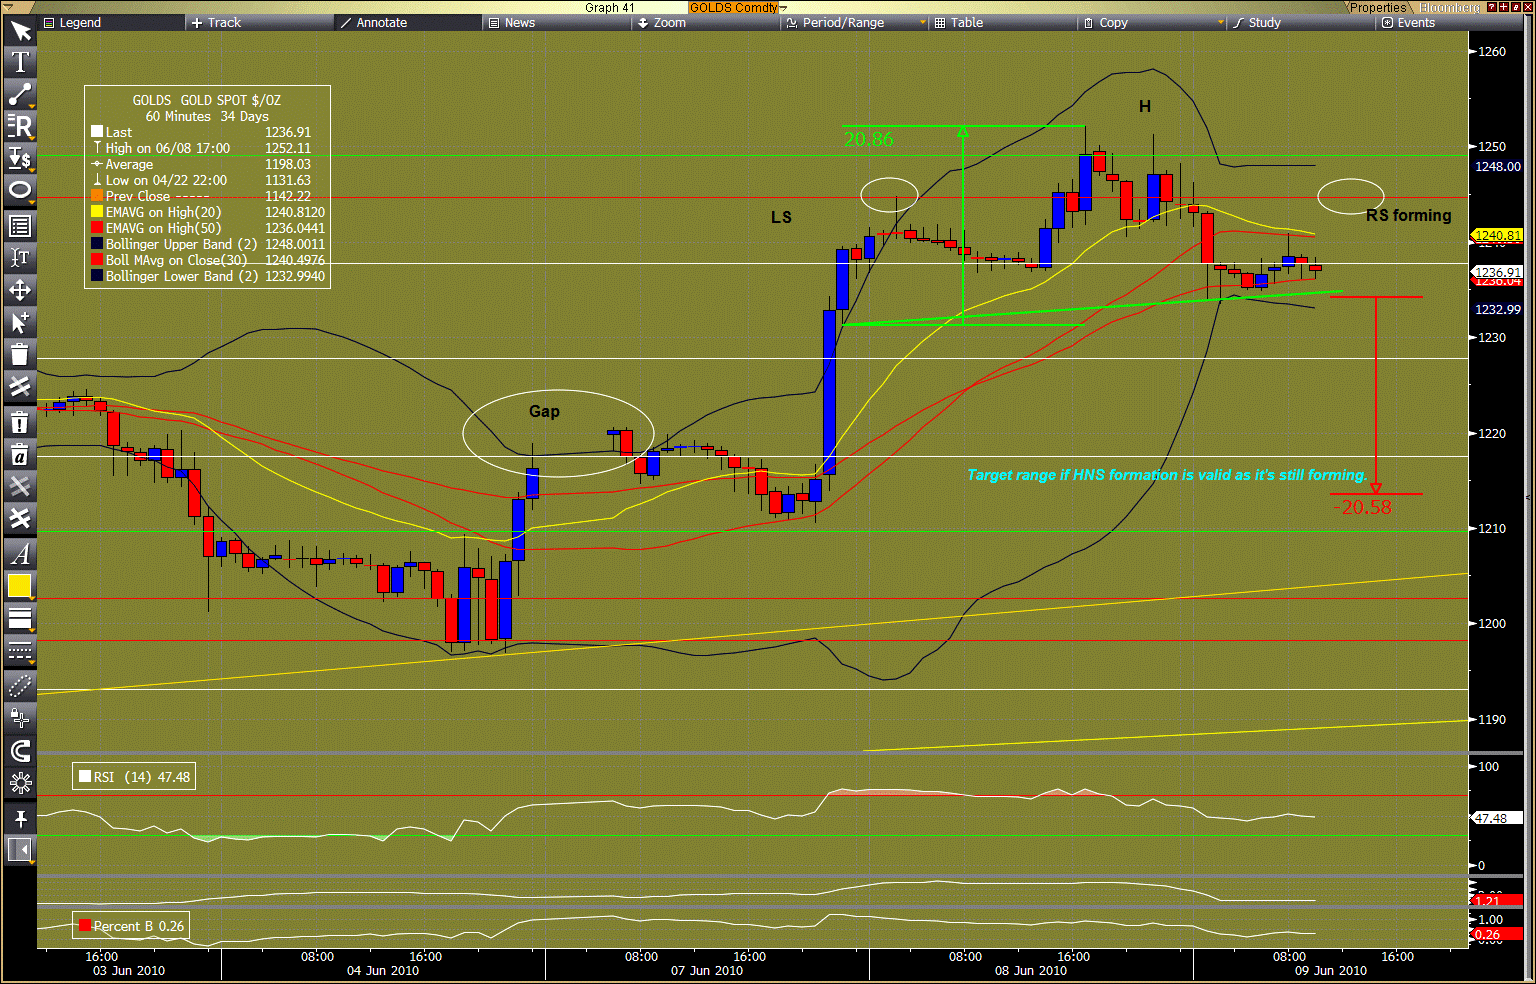
Gold might form a HNS formation in hourly chart, check the chart for details and targets.
Posted in Uncategorized | Leave a Comment »
Gold Daily – possible double top formation – 9 June 2010
Posted by commoditydaily on June 9, 2010
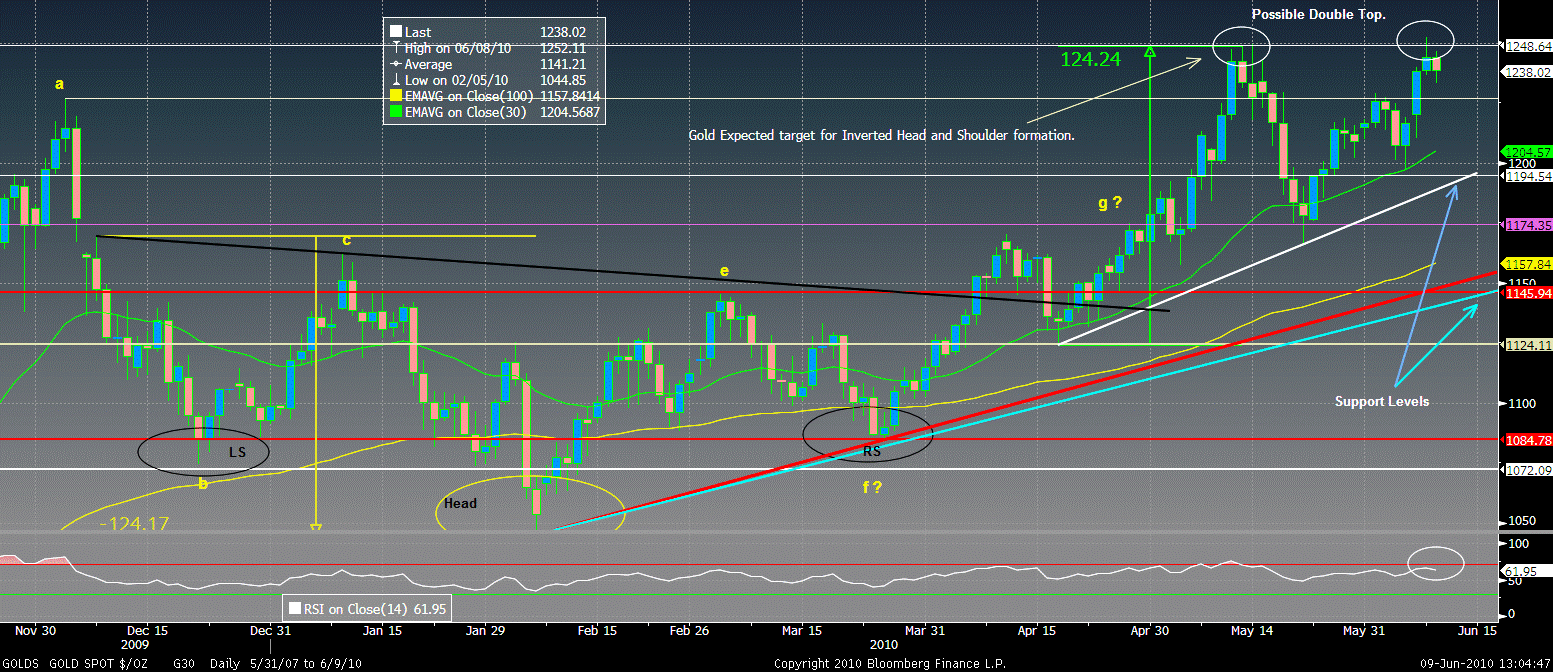
Chart 9th June 2010: Gold has taken support in the range of $1174-$1154 and bounced back to $1220 level indicated in my earlier update on 21st May 2010. Weakening Euro and lower than expected payroll data given boost to gold, and it has surged again towards all time high.
Gold Spot has replaced all time high on 08 June 2010 by making another top @ $1252 over the earlier top @ $1248 on 13 May 2010. From the chart, it seems that gold might form a double top formation after making another top near the earlier all time high (it’s too early to assume until the gold closes below $1174), but if it is true Gold may fall toward immediate supports @ $1225 and $1194 as indicated in the chart above. However, if gold find support at the above indicated levels and cross back the high again chances are bright that gold may touch $1300+.
Posted in Uncategorized | Leave a Comment »
